PCA is like a magic tool for making big, confusing data simpler and easier to understand. It helps us find the most important things in the data.
How PCA Works:
1. Data: Think of data as information about people. For example, you might have data about their height, weight, and age.
2. Centering Data: First, we find the "center" of the data by figuring out the average height, weight, and age of all the people. This is like where most people are in terms of these three things.
3. Calculating Relationships: PCA looks at how these things (height, weight, age) are connected to each other. It checks if they move together or separately.
4. Orthogonal Vectors: PCA finds special ways to look at the data, called "orthogonal vectors." These vectors are like arrows pointing in different directions. Each arrow shows a different aspect of the data.
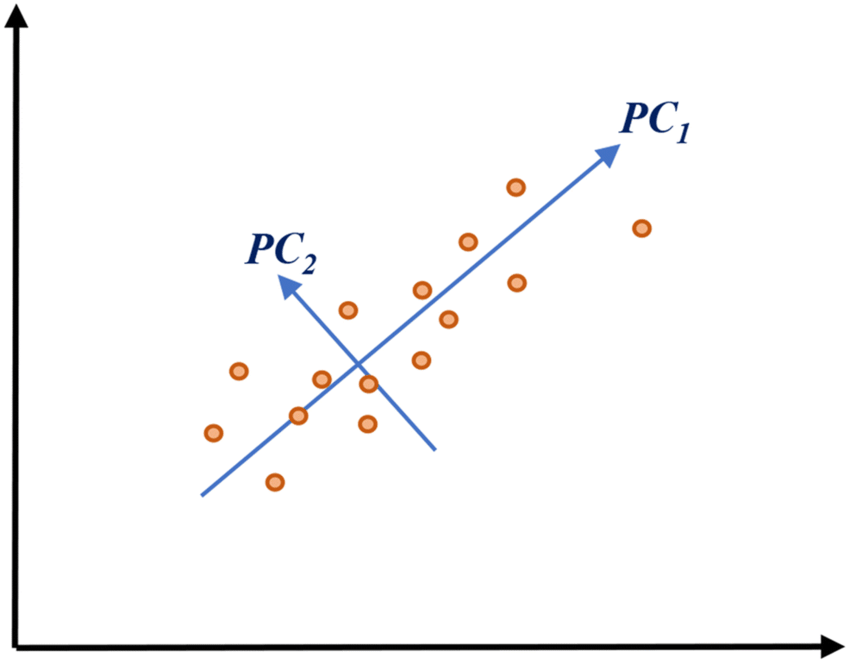
- The first arrow (the first vector) shows us the biggest difference in the data, like the main story.
- The second arrow (the second vector) shows us the second biggest difference, and so on.
5. Eigenvalues and Eigenvectors: The length of each arrow (vector) is called an "eigenvalue." It tells us how important that arrow is. The longer the arrow, the more important it is.
- The direction of each arrow (vector) is called an "eigenvector." It tells us what aspect of the data that arrow represents.
6. Reduced Data: We can change our data into these special ways of looking at it using the arrows. It's like having a new, simpler set of information.
Why Use PCA:
- We use PCA to understand our data better.
- It helps us see the main things that matter and ignore the less important stuff.
In simple words, PCA helps us make our data simpler by finding the most important aspects (represented by orthogonal vectors with long eigenvalues) and understanding them better.
No comments:
Post a Comment